Analysis of newly acquired literature
NEWLY PROCURED LIBRARY MATERIAL
Table 1. Number of newly acquired library materials by study programs in the period from 2013 to 2020.
|
R.br. |
Studijski program |
Broj jedinica nabavljene bibliotečke građe |
||
|
od 2013. do 2016. godine |
od 2016. do 2018. godine |
od 2018. do 2020. godine |
||
|
1 |
Integrisane akademske studije farmacije |
179 |
549 |
215 |
|
2 |
Sestrinstvo |
152 |
261 |
124 |
|
3 |
Osnovne akademske studije psihologije |
77 |
54 |
93 |
|
4 |
Poljoprivredna proizvodnja |
61 |
136 |
101 |
|
5 |
Agroekonomija |
55 |
122 |
93 |
|
Ukupno za period |
524 |
1122 |
626 |
|
|
UKUPNO u periodu od 2013. do 2020. godine |
2272 |
|||
At the proposal of the Commission for Quality Assurance, two records were made, which are presented in the Self-Evaluation Reports for the period from 2013 to 2016, as well as subsequent analyzes for the period from 2016 to 2020.
- Records of added library materials and
- Records of the number of library materials per student.
It can be concluded that the University Library currently has satisfactory capacities, ie that it has the space and equipment that enables efficient teaching and other activities, which are realized by our University.
The increase in the number of library units is evident, and we conclude that the largest number of literary units refers to the study program of the Integrated Academic Study of Pharmacy, since we also have the largest number of enrolled students in the mentioned study program.
As a corrective measure in previous reports was the renewal of the book fund and the acquisition of new library materials by the University, which certainly favored a better and higher quality teaching process.
The change of study programs during 2020 also included the analysis of the syllabus of subjects by study programs in order to determine the lack of mandatory literature, and accordingly we procured it.
The number of newly acquired library materials has been monitored since the beginning of the University's work, because efforts were made to comply with the recommendations of the Quality Assurance Commission on the need for continuous acquisition of new library units. Every year, analyzes were performed on the basis of the Records made by the library service. Certain data are presented in the Self-Evaluation Report for the period 2013-2016, as well as subsequent analyzes for the academic year 2016/2017 and the academic year 2017/2018.
Graph 1. Continuous acquisition of the library fund.
Status of the total number of library units
At the proposal of the Commission for Quality Assurance, and as part of the continuous monitoring of quality at the University of Bijeljina, the Analysis of the total fund of library materials in 2014/2015 was performed and the ratio of the number of publications to previous years is shown.
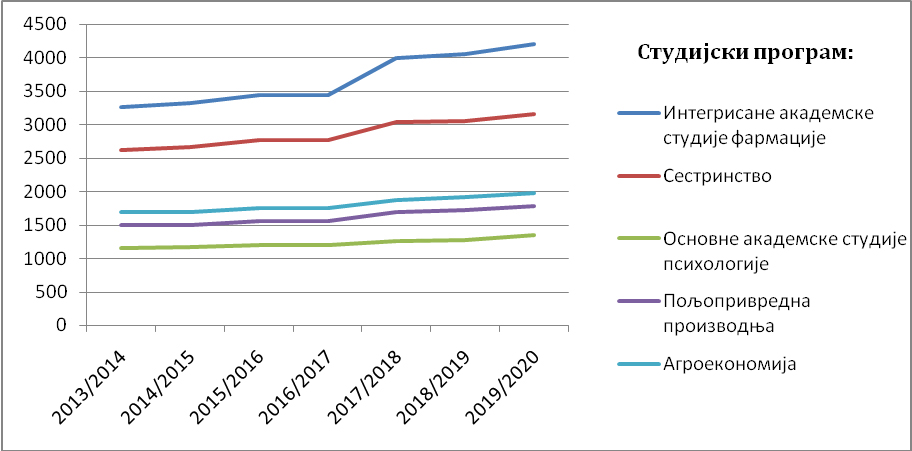
Table 2. Analysis of the state of library materials by faculties for the period from the academic year 2013/2014 to the academic year 2019/2020.
|
R. br. |
Studijski program |
Broj bibliotečke građe 2013/2014 |
Broj bibliotečke građe 2014/2015 |
Broj bibliotečke građe 2015/2016 |
Broj bibliotečke građe 2016/2017 |
Broj bibliotečke građe 2017/2018 |
Broj bibliotečke građe 2018/2019 |
Broj bibliotečke građe 2019/2020 |
|
1 |
Integrisane akademske studije farmacije |
3263 |
3322 |
3442 |
3442 |
3991 |
4056 |
4206 |
|
2 |
Sestrinstvo |
2623 |
2670 |
2775 |
2775 |
3036 |
3058 |
3160 |
|
3 |
Osnovne akademske studije psihologije |
1151 |
1164 |
1198 |
1198 |
1252 |
1269 |
1345 |
|
4 |
Poljoprivredna proizvodnja |
1492 |
1492 |
1553 |
1553 |
1689 |
1734 |
1790 |
|
5 |
Agroekonomija |
1700 |
1700 |
1755 |
1755 |
1877 |
1919 |
1970 |
|
Ukupno stanje po godinama |
10229 |
10348 |
10723 |
10723 |
11845 |
12036 |
12471 |
|
The previous table shows the analysis of the state of the number of library units by study programs and years, as well as the state of the number of library units in all study programs, concluding with the academic year 2019/2020.
According to the above table, the continuous growth of newly acquired literature is evident, from year to year, which can be clearly seen in Graph 2.
Graph 2. Tendency of growth of library units in the period of the academic year 2013/2014 to 2019/2020.